Google PageSpeed Insights: How To Read Scores And Fix Speed
Categories: Legal Marketing Strategies
 Abram Ninoyan
Founder & Senior Performance Marketer
Credentials: Google Partner, Google Ads Search Certified, Google Ads Display Certified, Google Ads Measurement Certified, Google Analytics (IQ) Certified, HubSpot Inbound Certified, HubSpot Social Media Marketing Certified, Conversion Optimization Certified
Expertise: Google Ads, Meta Ads, Conversion Rate Optimization, GA4 & Google Tag Manager, Lead Generation, Marketing Funnel Optimization, PPC Management
LinkedIn Profile
A potential client searches for a personal injury lawyer, clicks your website, and waits. Three seconds pass. Five seconds. They hit the back button and click the next firm on the list. That case, and...
Google PageSpeed Insights: How To Read Scores And Fix Speed
A potential client searches for a personal injury lawyer, clicks your website, and waits. Three seconds pass. Five seconds. They hit the back button and click the next firm on the list. That case, and the revenue attached to it, is gone. Google PageSpeed Insights is the free tool Google built to help you diagnose exactly why your site loads slowly and what you can do to fix it.
But here's the problem: most attorneys open the tool, see a score between 0 and 100, and have no idea what to do next. The report is packed with technical jargon, Largest Contentful Paint, Cumulative Layout Shift, Time to Interactive, and none of it translates on its own into a clear action plan. Without understanding what each metric actually measures, you're flying blind. And a slow website doesn't just frustrate visitors; it actively hurts your search rankings, pushing your firm further down the results page where fewer people will ever find you.
At GavelGrow, we've optimized site performance for over 500 law firms, and speed is one of the first things we audit in every engagement. This guide breaks down how PageSpeed Insights actually works, what each score and metric means in plain English, and the specific fixes that will make the biggest difference for your firm's site. Whether you plan to hand this off to a developer or tackle it yourself, you'll walk away knowing exactly where your site stands and what to prioritize first.
Why PageSpeed Insights matters for SEO and conversions
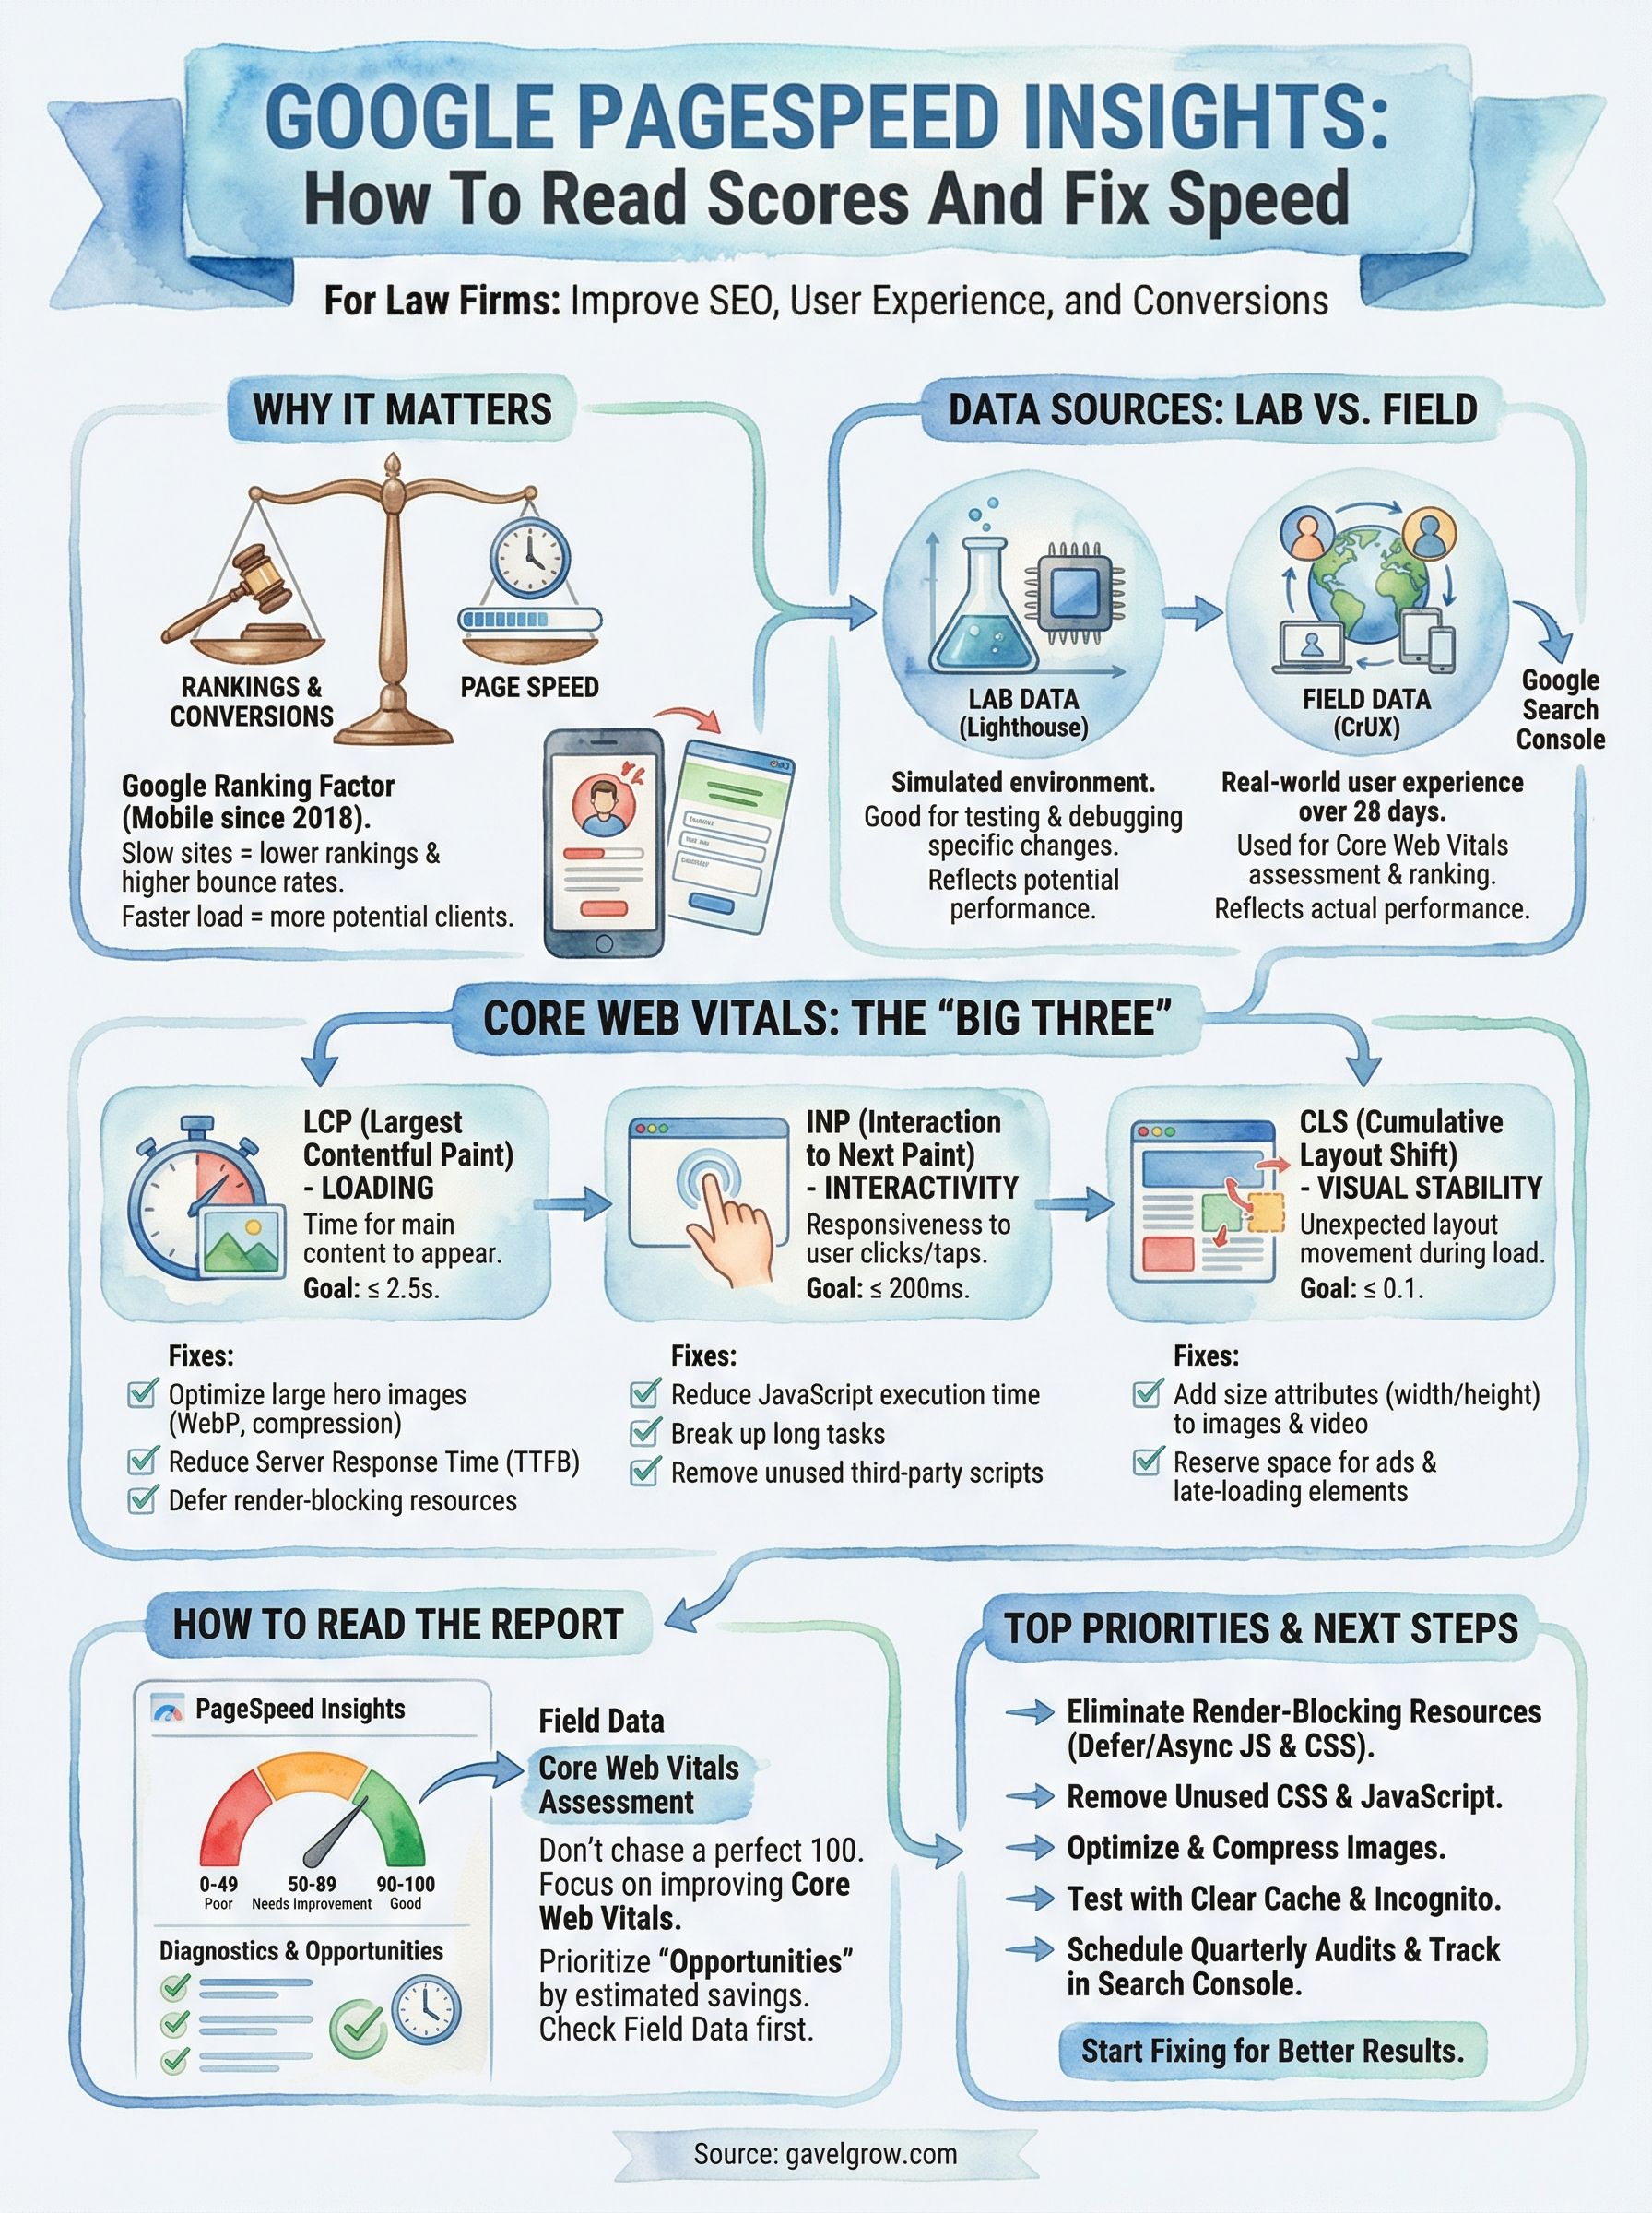
Page speed is not a vanity metric. Google made it an official ranking factor for mobile searches in 2018 with the Speed Update, and since then the bar has only risen. When your site loads slowly, you pay a double penalty: your rankings drop, and the visitors who do land on your page leave before they read a single word. For law firms competing in local search, where the difference between signing a case and losing it often comes down to who shows up first and loads fastest, that double penalty hits your bottom line directly.
How Google uses page speed as a ranking signal
Google's ranking systems evaluate hundreds of signals, and Core Web Vitals are among the most concrete ones you can directly control. These are the specific loading, interactivity, and visual stability metrics that Google measures and weighs when deciding where your pages rank. Since the Page Experience update rolled out across both mobile and desktop, Google Search Console surfaces these metrics for every URL on your site and flags the ones that fall below the threshold. Google has publicly confirmed that pages with poor Core Web Vitals face ranking pressure compared to otherwise equivalent pages that meet the standard.
Running your site through google pagespeed insights gives you a direct window into how Google evaluates your performance. The tool pulls from the same real-world data set Google uses in its ranking systems, which means the scores you see are not abstract numbers. They represent real signals that affect your visibility in search results right now, not in some future algorithm update.
A well-optimized page with strong Core Web Vitals does not just rank better; it signals to Google that your site deserves to be recommended to users searching for legal help.
What slow load times do to your conversion rate
Speed has a direct, measurable effect on whether visitors actually contact your firm. Google's own research shows that as page load time increases from one second to three seconds, the probability of a visitor bouncing jumps by 32 percent. Push that to five seconds and the bounce probability reaches 90 percent. For a law firm where a single signed case can represent thousands of dollars in revenue, losing nine out of ten visitors before they see your contact form is a serious problem, not a minor inconvenience.
Many attorneys focus their marketing budgets on paid ads and SEO content while ignoring the technical foundation underneath those investments. You can spend thousands of dollars driving targeted traffic to a page that loads in six seconds on a mobile device and watch most of that budget disappear. Every dollar you put into Google Ads, local SEO, or content marketing returns less when the landing page cannot hold the attention of the people it attracts.
The math is straightforward. If your site receives 500 visitors per month from paid search and your bounce rate drops by 20 percent because load time improves from five seconds to two, that is 100 additional people reaching your practice area page and potentially calling your office. Speed improvements do not benefit just one channel; they compound across every traffic source, every campaign, and every dollar you spend to get someone to your site. Fixing speed is one of the few optimizations that makes everything else you are already paying for work better.
What PageSpeed Insights measures and where data comes from
Google PageSpeed Insights pulls from two distinct data sources, and understanding which is which changes how you interpret every number you see in the report. The tool does not simply time how long your page takes to load. It runs a structured performance audit and cross-references that audit against real-world data collected from actual Chrome users who visited your site. Knowing the difference between these two sources helps you stop obsessing over a single score and start making decisions that actually move the needle for your firm.
Lighthouse: the lab test that audits your page
Lighthouse is the open-source auditing engine that Google built and maintains. When you enter your URL into google pagespeed insights, Lighthouse loads your page in a controlled, simulated environment using a mid-tier mobile device profile and a throttled network connection. It measures how the page performs under those fixed conditions and generates a Performance score, which reflects a weighted average of the specific speed metrics Lighthouse captures during that simulated load.
Because Lighthouse runs in a controlled environment, results can shift slightly between tests. Server response times, third-party scripts, and even the time of day can move the score by several points from one run to the next. Running the test three times and averaging the results gives you a more reliable baseline than trusting any single number.
Treat Lighthouse scores as a diagnostic checkpoint, not a report card. The goal is to identify patterns across multiple tests, not to optimize for one number.
CrUX: the real user data behind the report
The Chrome User Experience Report (CrUX) collects performance data from real Chrome users who have opted into sharing usage statistics. This data feeds directly into the Core Web Vitals assessment you see in the Field Data section of the report. Unlike Lighthouse, CrUX reflects how your page actually performed across a rolling 28-day window of real visits, on real devices, across real network conditions.
If your field data shows a "Poor" rating for Largest Contentful Paint, that means actual visitors experienced slow load times, not just a simulated test. CrUX data is also what Google's ranking systems use, which makes it the more consequential of the two sources when you are evaluating your site's search performance.
How to read the report without chasing a perfect 100
The Performance score at the top of every google pagespeed insights report sits in one of three color zones: red (0-49), orange (50-89), or green (90-100). That number gets a lot of attention, but chasing a perfect 100 is a misuse of your time and budget. A score of 72 on mobile does not mean your site is broken. It means specific, fixable issues are slowing your page down, and the report tells you exactly which ones matter most.
What the color thresholds actually mean
Google designed the scoring thresholds to reflect the real-world performance experience your visitors have. A green score does not guarantee fast load times, and a red score does not mean your site is unusable. The score is a weighted composite of several individual metrics, and some of those metrics carry far more weight than others. For example, Largest Contentful Paint and Total Blocking Time each contribute a large share to the overall score, so a single improvement in either can move your number significantly.
Focus your energy on the metrics with the highest weighting before touching anything else; a targeted fix there will move your score more than a dozen small optimizations combined.
The score also shifts based on whether you are viewing mobile or desktop results. Mobile consistently scores lower because Lighthouse simulates a slower device and a throttled network connection. Most law firm clients search on mobile, so the mobile score is the one that reflects your actual audience's experience and the version Google weighs more heavily for rankings.
Which sections of the report demand your attention
Below the overall score, the report breaks into Diagnostics and Opportunities. Opportunities are the fixes that will directly reduce load time, each with an estimated time savings shown next to it. Diagnostics flag issues that affect performance indirectly. Start with the Opportunities section and sort by the largest estimated savings first. That list tells you where Google believes your page loses the most time.
The Passed Audits section, which many people skip entirely, shows what your site is already doing correctly. Reviewing it prevents you from asking a developer to fix something that is not broken. Reading the full report top to bottom, rather than reacting to the score alone, gives you a clear, prioritized action list instead of a number to feel stressed about.
Lab data vs field data and how to use both
The google pagespeed insights report shows you two different views of your site's performance, and treating them as interchangeable is a mistake that leads to wasted fixes. Lab data comes from Lighthouse running a controlled simulation. Field data comes from real Chrome users who visited your site over the past 28 days. Both are useful, but for different reasons, and knowing when to lean on each one changes how you prioritize your work.
How to use lab data for testing and debugging
Lab data gives you a repeatable, controllable environment where you can measure the impact of a specific change before pushing it live. When a developer removes a large image file or defers a blocking JavaScript file, lab data shows the result immediately, even if field data has not yet caught up. This makes Lighthouse your primary testing tool whenever you are actively making changes to your site.
Because lab data simulates a throttled mobile connection and a mid-range device, it also surfaces performance issues that high-speed office internet connections tend to mask. Many law firm websites look fast when loaded on a desktop at the office and load painfully slowly for a prospective client on a 4G connection during their commute. Lab data exposes that gap before it costs you a consultation.
Use lab data to test changes and diagnose specific issues; use field data to confirm that those changes improved the experience for real visitors.
How to use field data to confirm real-world impact
Field data reflects the actual experience of visitors who reached your site on their own devices and network conditions over the past 28 days. After you make a significant performance improvement, field data is the confirmation signal that tells you whether the fix made a meaningful difference in the real world. Because it aggregates thousands of real page loads, it filters out the noise that individual Lighthouse tests can introduce.
One important limitation: field data requires sufficient traffic to generate reliable measurements. If your site receives low traffic volume, Google may show "Insufficient Data" in the field data section, which means lab data becomes your primary reference until traffic builds. Check both sections every time you run a performance audit so you have the complete picture of where your site actually stands rather than relying on a single data point.
How to run PageSpeed Insights tests that you can trust
Raw test results from google pagespeed insights can mislead you if you run them carelessly. Network congestion, active browser extensions, cached resources, and third-party scripts firing at different times can all shift your score by 10 to 20 points between runs. Before you hand a report to a developer or start making changes based on a single number, you need to make sure the data you are looking at is actually reliable.
Clear your cache and disable browser extensions before testing
Browser extensions like ad blockers, password managers, and analytics overlays actively interfere with how a page loads during a test. Even if you are using the tool's web interface rather than running Lighthouse locally, any extensions running in your browser can inject scripts or modify resources. Open an incognito window or a clean browser profile before you run a test so nothing in your browser environment contaminates the result.
Cached files from previous visits can also skew results in the opposite direction, making your page look faster than it really is for a first-time visitor. A first-time visitor is exactly who you are trying to optimize for, since returning visitors benefit from cached resources while new prospects land cold. Clearing your cache before each test session gives you a more accurate picture of the experience your potential clients actually have.
A single test result is a data point; three or more test results taken under clean conditions are a baseline you can actually trust.
Test at multiple times of day and average your results
Server load fluctuates throughout the day, and your site's response time will vary depending on when you run the test. A page that scores 68 at 2 AM when your server is idle may score 54 at midday when traffic peaks. Running three separate tests at different times, ideally across different days, and averaging the scores gives you a baseline that smooths out those fluctuations.
Record each score in a simple spreadsheet alongside the date, time, and device type. This log becomes your performance history and lets you measure whether a change you made actually improved results over time, rather than guessing. Systematic testing is what separates a decision backed by evidence from one based on a misleading snapshot.
How to prioritize fixes using Core Web Vitals
The google pagespeed insights report surfaces a long list of potential issues, and trying to fix everything at once is a reliable way to burn developer time without moving the needle. Core Web Vitals give you a focused starting point by identifying the three metrics that Google weighs most heavily and that have the clearest connection to how real visitors experience your site. Fix these first, and the broader performance score tends to follow.
The three metrics that drive your score the most
Core Web Vitals consist of three distinct measurements: Largest Contentful Paint (LCP), which tracks how long your main content takes to appear; Interaction to Next Paint (INP), which measures how quickly the page responds after a user taps or clicks; and Cumulative Layout Shift (CLS), which captures how much your page layout moves unexpectedly during load. Each metric has a clear passing threshold. LCP should be 2.5 seconds or faster, INP should be 200 milliseconds or less, and CLS should stay below 0.1.
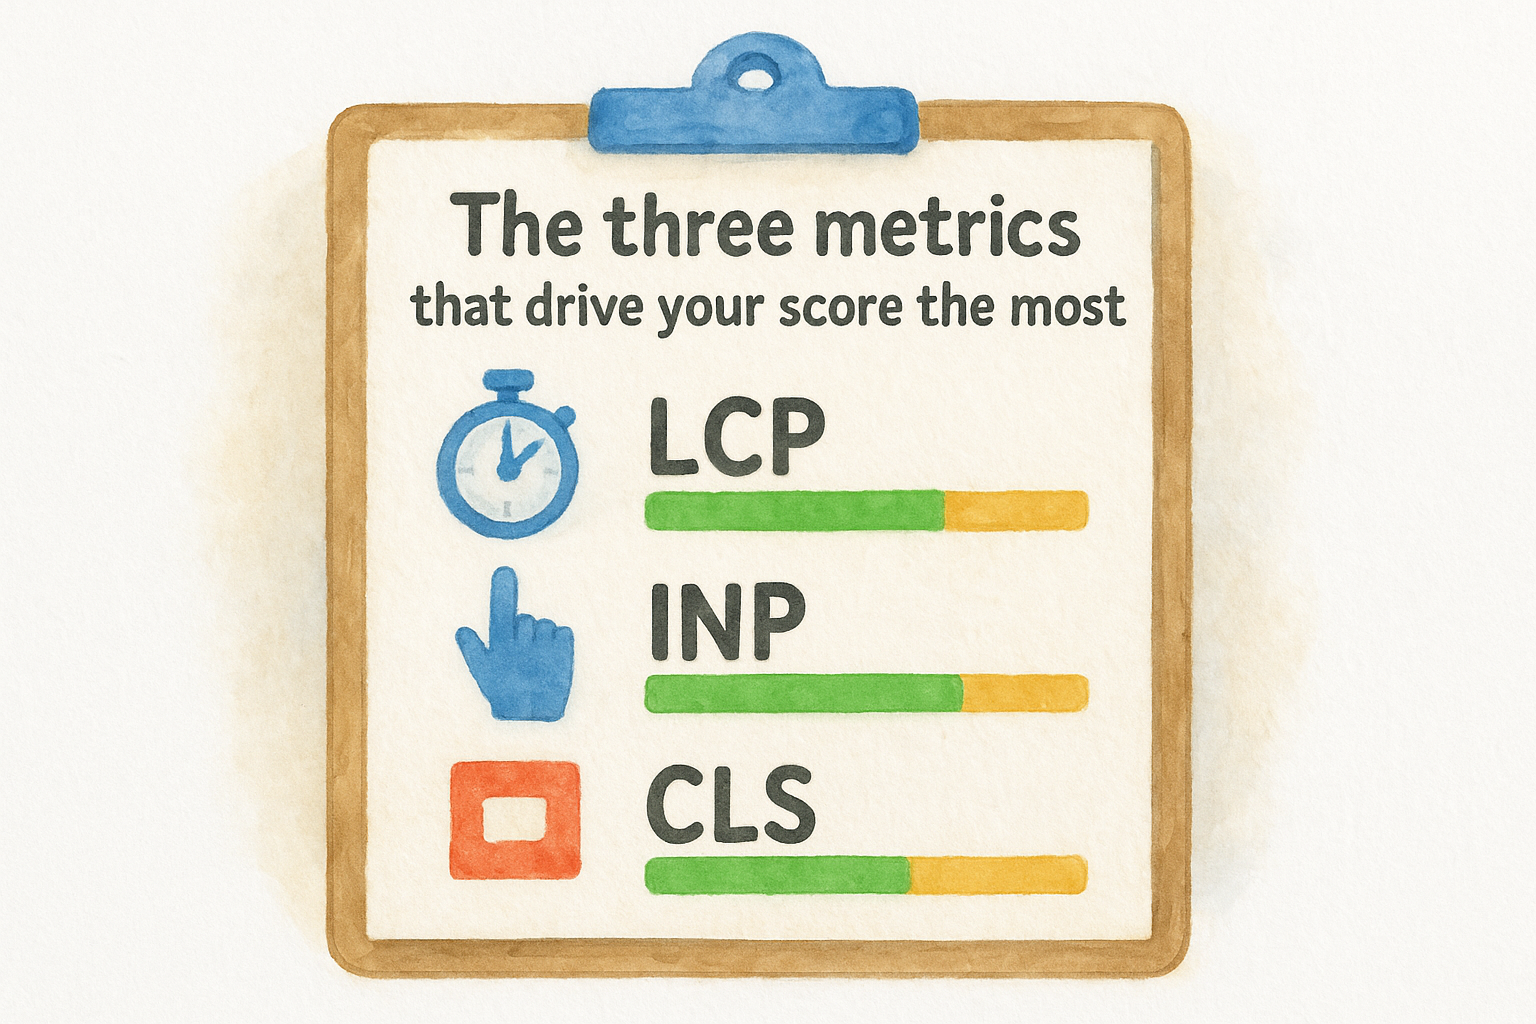
Google treats any page that fails even one of these thresholds as not passing the Core Web Vitals assessment. That assessment feeds directly into your site's Page Experience signals, which means a single failing metric can suppress your rankings regardless of how well the rest of your site performs. Address failing Core Web Vitals before spending time on any other audit item the report flags.
One failing Core Web Vital cancels out every other performance win on that page from a search ranking perspective.
How to use the report to rank fixes by impact
Pull up your report and check the Field Data section first. This section shows how your site scored on each Core Web Vital across real user visits, color-coded as Good, Needs Improvement, or Poor. Any metric showing red or orange is your highest priority. Once you know which metric is failing, scroll to the Diagnostics and Opportunities sections and filter your attention to the items that directly affect that metric. LCP failures usually trace back to slow server response times or large unoptimized images. INP failures point to heavy JavaScript. CLS failures stem from images without defined dimensions or late-loading ads.
Work through each failing metric one at a time rather than jumping between issues. This approach keeps your developer focused, makes it easier to measure the impact of each fix, and prevents changes from interfering with one another.
How to improve LCP for faster loading
Largest Contentful Paint measures how long it takes for the largest visible element on your page to fully render, which is usually a hero image, a large heading block, or a banner photo. When google pagespeed insights flags your LCP as Poor, it means visitors are staring at an incomplete page for more than 2.5 seconds before your main content appears. For a law firm website, that delay often happens before a prospective client even sees your phone number or call-to-action, which means the fix directly affects how many people actually contact your office.
Optimize your largest image or hero element
The hero image at the top of most law firm pages is the single most common cause of a failing LCP score. Large, uncompressed image files force the browser to download heavy data before it can display anything meaningful to the visitor. Start by compressing every hero image using a modern format like WebP, which delivers significantly smaller file sizes at the same visual quality compared to JPEG or PNG.
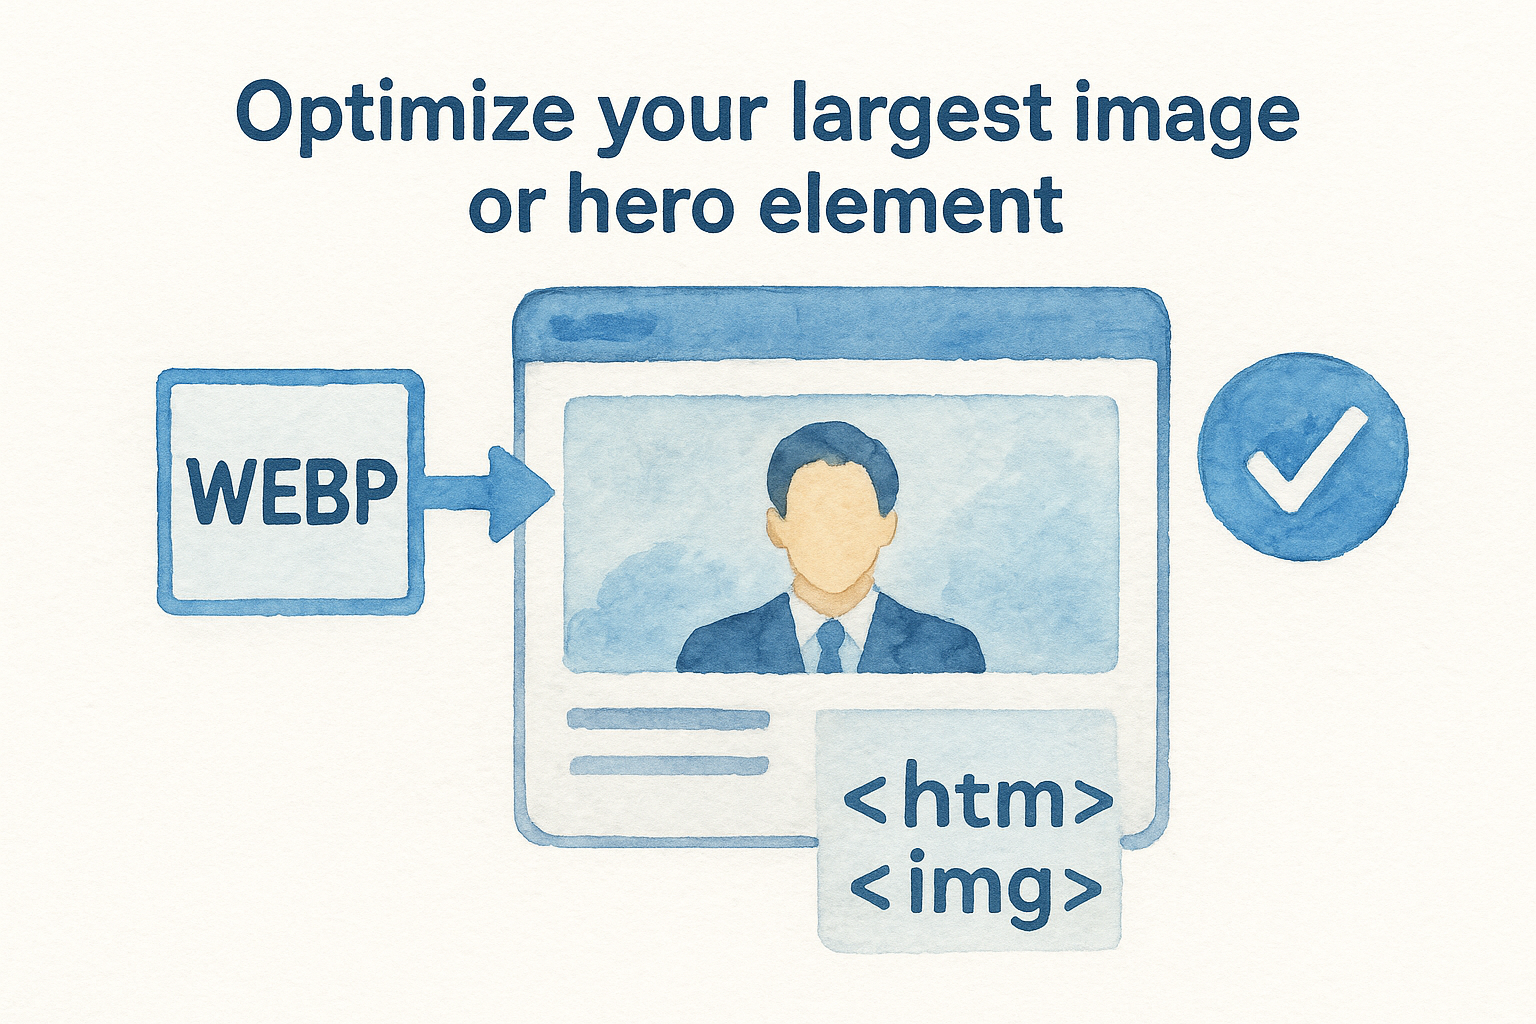
Beyond compression, add a <code>fetchpriority="high"</code> attribute to the HTML tag of your LCP image. This tells the browser to load that specific resource before anything else on the page, rather than treating it as one item in a long queue. You should also remove any <code>lazy-load</code> attribute from your hero image, since lazy loading intentionally delays images until they are needed and directly conflicts with getting your LCP element on screen as fast as possible.
Preloading your LCP image using a <code><link rel="preload"></code> tag in your page's <code><head></code> section is one of the fastest, lowest-risk improvements you can make without touching your server or hosting plan.
Reduce server response time and render-blocking resources
A slow Time to First Byte (TTFB) puts a ceiling on how fast your LCP can ever be, because the browser cannot begin loading any content until your server responds. If your server takes more than 600 milliseconds to respond, even a perfectly optimized image will produce a failing LCP score. Switching to a faster hosting plan or enabling server-side caching resolves the majority of TTFB problems without requiring code changes.
Render-blocking JavaScript and CSS files delay LCP by forcing the browser to pause and process scripts before it can paint anything to the screen. Defer non-critical JavaScript using the <code>defer</code> attribute and move large CSS files to load asynchronously where your layout permits. These two changes together often produce the largest single jump in your LCP score.
How to improve INP for better responsiveness
Interaction to Next Paint (INP) replaced First Input Delay as a Core Web Vital in 2024, and it measures something more demanding: how quickly your page responds every time a user taps, clicks, or interacts, not just the first time. When google pagespeed insights flags your INP as Poor, it means visitors are experiencing noticeable lag after they interact with your page, whether they are clicking your phone number, submitting a contact form, or tapping a navigation menu. On a law firm website, that lag creates friction exactly where you need a potential client to take action.
Reduce JavaScript execution time
Heavy JavaScript is the root cause of most INP failures. Every script your page loads forces the browser's main thread to pause and process code, which blocks it from responding to user input during that window. Law firm websites commonly load multiple tracking scripts, chat widgets, and third-party marketing tools that all compete for the same main thread at the same time. Auditing which scripts are actually necessary and removing or deferring the rest is the single highest-impact step you can take to lower your INP score.
Third-party scripts from analytics platforms, live chat tools, and ad networks are frequent offenders that many site owners never audit because they were added one at a time over months or years. Use the Coverage tab in Chrome DevTools to identify scripts that load significant unused code on your key pages. Every kilobyte of JavaScript you remove from the critical path is processing time you return to the browser, which directly shortens the delay between a visitor's tap and the page's response.
Removing one heavy, unused script often improves INP more than a dozen smaller code optimizations combined.
Break up long tasks that block the main thread
A long task is any script that runs for more than 50 milliseconds without yielding control back to the browser. When a long task runs, the browser cannot respond to user input until it finishes, which is what produces the visible lag that INP captures. Developers can break long tasks into smaller chunks using <code>scheduler.yield()</code> or by wrapping work in <code>setTimeout</code> calls that give the browser brief windows to process pending interactions.
Input handlers that contain heavy logic are another common source of long tasks on law firm sites. Moving complex calculations or DOM manipulations out of click and tap handlers and into separate, deferred functions gives the browser room to register and respond to the interaction immediately, then handle the follow-up work afterward.
How to reduce CLS for a stable layout
Cumulative Layout Shift (CLS) measures how much your page visually jumps around while it loads, and a score above 0.1 means visitors are experiencing a layout that shifts unexpectedly beneath their fingers or cursor. On a law firm website, that instability makes your firm look unprofessional, and it creates a practical hazard: a prospective client trying to tap your phone number can accidentally click an ad or the wrong button because an element shifted at exactly the wrong moment. Google PageSpeed Insights flags the specific elements causing the shift so you know precisely where to start.
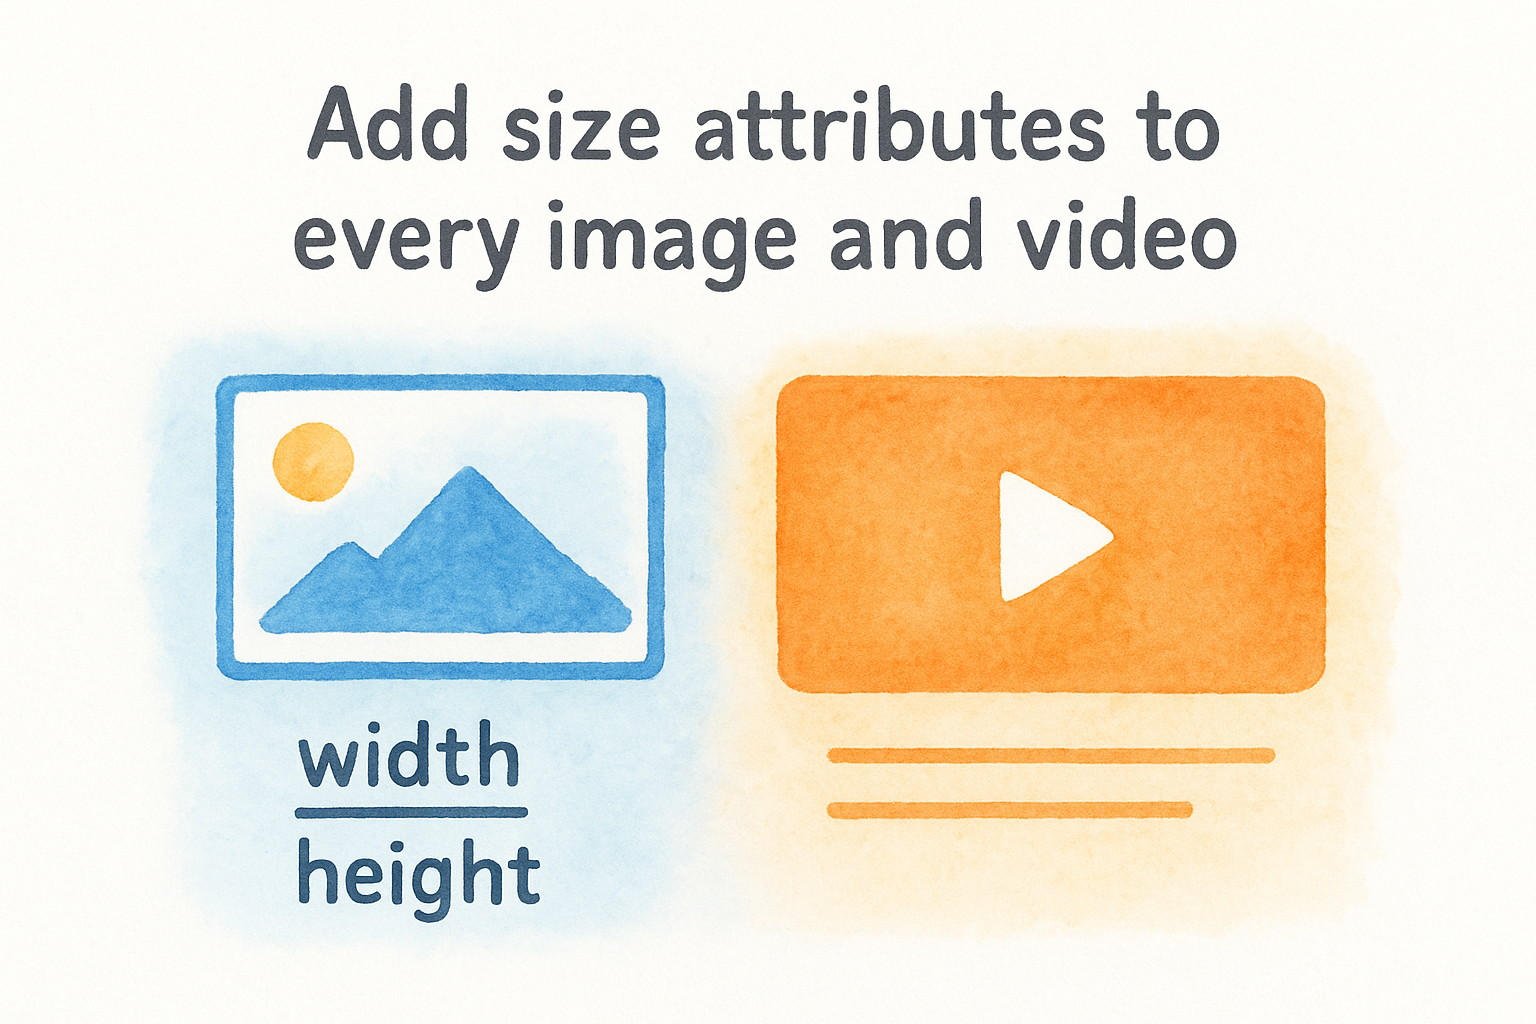
Add size attributes to every image and video
The most common cause of layout shift is images and videos that load without defined width and height attributes in their HTML. When the browser encounters an image without explicit dimensions, it reserves no space for it while the page loads. The moment the image downloads and renders, everything below it jumps down to make room, which is what produces that jarring shift visitors experience. Adding <code>width</code> and <code>height</code> attributes directly to every <code><img></code> and <code><video></code> tag tells the browser exactly how much space to reserve before the file finishes downloading.
Modern CSS can reinforce this fix by setting <code>aspect-ratio</code> on image containers, which preserves the correct proportions even when images scale responsively across different screen sizes. For a law firm site with a team photo, a hero banner, and individual attorney headshots, every image on the page is a potential CLS source until it carries explicit dimensions.
Reserving space for images before they load is the single fastest CLS fix available, and it requires only a minor HTML change with no impact on visual design.
Reserve space for ads and late-loading elements
Chat widgets, cookie consent banners, and ad units are frequent CLS offenders on law firm websites because they inject themselves into the page layout after the initial content has already rendered. When a chat widget appears at the bottom of the screen and pushes your contact button upward, or a cookie banner drops in from the top and shifts your navigation, every visitor who loaded that page during the 28-day CrUX window contributed to your CLS score. Reserve fixed space for these elements using <code>min-height</code> CSS properties on their containers so the layout holds its position regardless of when the element actually loads.
The highest-impact fixes PageSpeed Insights flags
Beyond Core Web Vitals, google pagespeed insights surfaces a set of recurring issues that consistently produce the largest time savings across law firm websites. These are not edge cases or minor tweaks; they appear on the majority of sites and each one directly delays how fast your page becomes usable. Fixing them systematically, starting with the ones carrying the highest estimated savings, delivers more return than trying to address every audit item in the report.
Eliminate render-blocking resources
Render-blocking resources are JavaScript and CSS files that the browser must fully download and process before it can display anything on screen. Every render-blocking file adds a hard wait to your page load, and most law firm websites carry several of them without realizing it. Adding <code>defer</code> or <code>async</code> attributes to non-critical scripts moves that processing work off the critical path so the browser can paint your visible content first and handle the remaining scripts afterward.
Deferring even one or two render-blocking scripts can cut several seconds from your LCP without any change to how your page looks or functions.
Critical CSS, meaning the styles needed to render your above-the-fold content, should load inline so the browser never has to wait for an external stylesheet before it can draw the first visible elements. Any CSS that governs content below the fold can load asynchronously without any visible impact on what your visitors see first.
Remove unused CSS and JavaScript
Most law firm websites load far more code than their pages actually use. Page builders, theme frameworks, and plugin libraries ship large files where only a fraction of the code applies to any given page. The Coverage tool in Chrome DevTools shows you exactly what percentage of each file goes unused, giving you a clear target for what to trim or split.
Removing or splitting unused code reduces the total amount of data the browser must download, parse, and execute before your page responds to interaction. This directly lowers both your LCP and INP scores. If your site runs on WordPress, plugins that defer scripts on a per-page basis can automate much of this work without requiring a developer to rewrite code from scratch. The result is a leaner, faster page that holds your visitor's attention long enough to convert them into a consultation.
Next steps to keep your site fast
Running google pagespeed insights once is a starting point, not a finish line. Page speed degrades over time as new plugins get added, images get uploaded without compression, and third-party scripts accumulate. Schedule a full performance audit every 90 days and track your Core Web Vitals scores in Google Search Console monthly so you catch regressions before they cost you rankings or consultations.
After each audit, work through your Opportunities list in order of estimated savings, confirm the fix in lab data, then wait 28 days to verify the improvement shows in field data. Document every change you make and the score before and after, so you build a clear record of what moved the needle for your specific site.
If you want an experienced team to handle this for your firm, contact GavelGrow for a free strategy consultation and we will audit your site's performance alongside your full digital marketing foundation.