Google Ads Report Editor: Build and Save Law Firm Reports
Categories: Legal Marketing Strategies
 Abram Ninoyan
Founder & Senior Performance Marketer
Credentials: Google Partner, Google Ads Search Certified, Google Ads Display Certified, Google Ads Measurement Certified, Google Analytics (IQ) Certified, HubSpot Inbound Certified, HubSpot Social Media Marketing Certified, Conversion Optimization Certified
Expertise: Google Ads, Meta Ads, Conversion Rate Optimization, GA4 & Google Tag Manager, Lead Generation, Marketing Funnel Optimization, PPC Management
LinkedIn Profile
The Google Ads Report Editor is the browser tool under Reports in your account where you build a custom table or chart, pick the columns and filters you need, then save, download or schedule it. Open...
Key Takeaways
- What do you need before you open the Google Ads Report Editor?
- Step 1. Open the editor and start a report
- Step 2. Add columns, segments and filters
- Step 3. Save, share and schedule the report
The Google Ads Report Editor is the browser tool under Reports in your account where you build a custom table or chart, pick the columns and filters you need, then save, download or schedule it. Open it, choose a chart type, add the metrics that answer one question, filter out the noise, and save the report. Those steps take about 15 minutes, and a fourth step ties the numbers to signed cases instead of raw conversions.
The problem is that the default Google Ads views show everything at once. A managing partner asks which campaign signed the most cases last month, and the main screen cannot say. So someone exports data to a spreadsheet every month and rebuilds the same pivot by hand. Worse, a form fill from a prospective client and a call from a job seeker both count as one conversion.
This guide walks through the editor step by step. You will learn where to find it, which columns a law firm should add, how to schedule a report so it arrives in your inbox, and how to connect the output to cost per signed case. Three ready-to-copy report setups and a worked example are included.
What do you need before you open the Google Ads Report Editor?
You need a Google Ads account with conversion tracking running and one clear question for the report. The editor runs in your browser, so there is nothing to install.
Where the Report Editor lives
Click Reports in the left-hand menu of your account, then open the Report editor. Google moves menu items now and then, so if the label has shifted, search the account for "report editor". Google's own help page on custom reports shows the current layout.
Do not confuse it with Google Ads Editor, which is a separate desktop app. That app is for offline bulk edits to campaigns, such as rewriting 200 headlines, not for building performance reports. If your account offers AI-assisted report drafting, treat the result as a first draft, because you still need to know the editor to check what it builds.
Checklist before you start
Confirm these four things first. A report built on weak tracking looks precise and misleads you.
- Conversion actions that count real intake events, such as calls over a minimum length and submitted intake forms, not page views.
- At least 30 days of data, so you are not reading trends from a dozen clicks.
- One question written as a sentence, such as "Which campaigns cost the most per conversion?"
- A fixed definition of "conversion" that stays the same from one report to the next.
The question matters most. A report with no question turns into a wall of columns that nobody reads.
A report that starts with a clear question takes ten minutes to build and one minute to read.
Step 1. Open the editor and start a report
Start from a predefined report if one is close to what you need, and build from scratch only when none fits. Either way, you end up in the same editor.
Choose predefined or custom
Under Reports, the predefined reports cover common views such as time, geography, device and search terms. Open one, then change its columns and filters to make it your own. This is the fastest route for a first report, because the structure already works.
To build from scratch, click the + button and pick a format: table, bar chart, line chart or pie chart. For a law firm, start with a table. A table shows cost, conversions and cost per conversion side by side, which is what an owner scans first. Add a line chart later to show whether cost per conversion is climbing or falling.
Name the report so you can find it
Use a naming pattern from day one. A name like "Monthly | Search | Cost per conversion by campaign" tells you the cadence, the channel and the question. Six months from now you will have a dozen saved reports, and "Report 4" will mean nothing to you or your marketing manager.
Name every report after the question it answers, or you will rebuild it from memory in three months.
Step 2. Add columns, segments and filters
Columns hold the metrics, rows hold what you are breaking the data down by, and filters remove what does not matter. Get these three right and the report answers its question on its own.
Pick columns that match a law firm's questions
Add the columns below to a campaign-level table. Keep it to eight or ten, because every extra column dilutes the ones that matter.
- Cost: how much did we spend?
- Clicks and Impr.: are people seeing and clicking the ad?
- CTR: does the ad copy match what people search?
- Avg. CPC: what does each click cost in this practice area?
- Conversions: how many calls and forms came in?
- Cost / conv.: what does each lead cost?
- Conv. rate: how well does the landing page turn clicks into leads?
- Search impr. share: how much of the available demand do we reach?
- Search lost IS (budget): is the budget capping us?
The last column is the one firms skip. If you lose impression share to budget on your best campaign, raising spend there is often a smarter move than adding a new campaign.
Set rows, segments and filters
For rows, choose Campaign for an owner view, Keyword to judge bidding, or Search term to see the actual queries that triggered your ads. A segment splits those rows further. Useful segments for a firm are day of week, hour of day and device, because intake teams answer the phone at certain hours and mobile forms behave differently from desktop ones.

Then add filters. Three work almost everywhere:
- Cost greater than 0, to hide paused or dead rows.
- Campaign name contains a practice area, such as "DUI", to produce one report per practice group.
- Conversions greater than 0 on a second copy of the report, to see only what produced leads.
Finish by setting the date range and turning on a comparison to the previous period. A number only means something next to last month's number.
Eight well-chosen columns and two filters beat thirty columns nobody can read.
Step 3. Save, share and schedule the report
Click Save once the table answers your question, then download it or schedule it so it arrives without you. A saved report is reusable, so you never rebuild it.
Save and download
After saving, the report appears in your saved reports list, where you can reopen it and change the date range in seconds. To share it outside Google Ads, use the download option and choose a PDF for partners or a CSV or Excel file for anyone who wants to sort the data. PDF is the format for a partner meeting. CSV is for the person doing the analysis.
Schedule it by email
Scheduling takes under a minute:
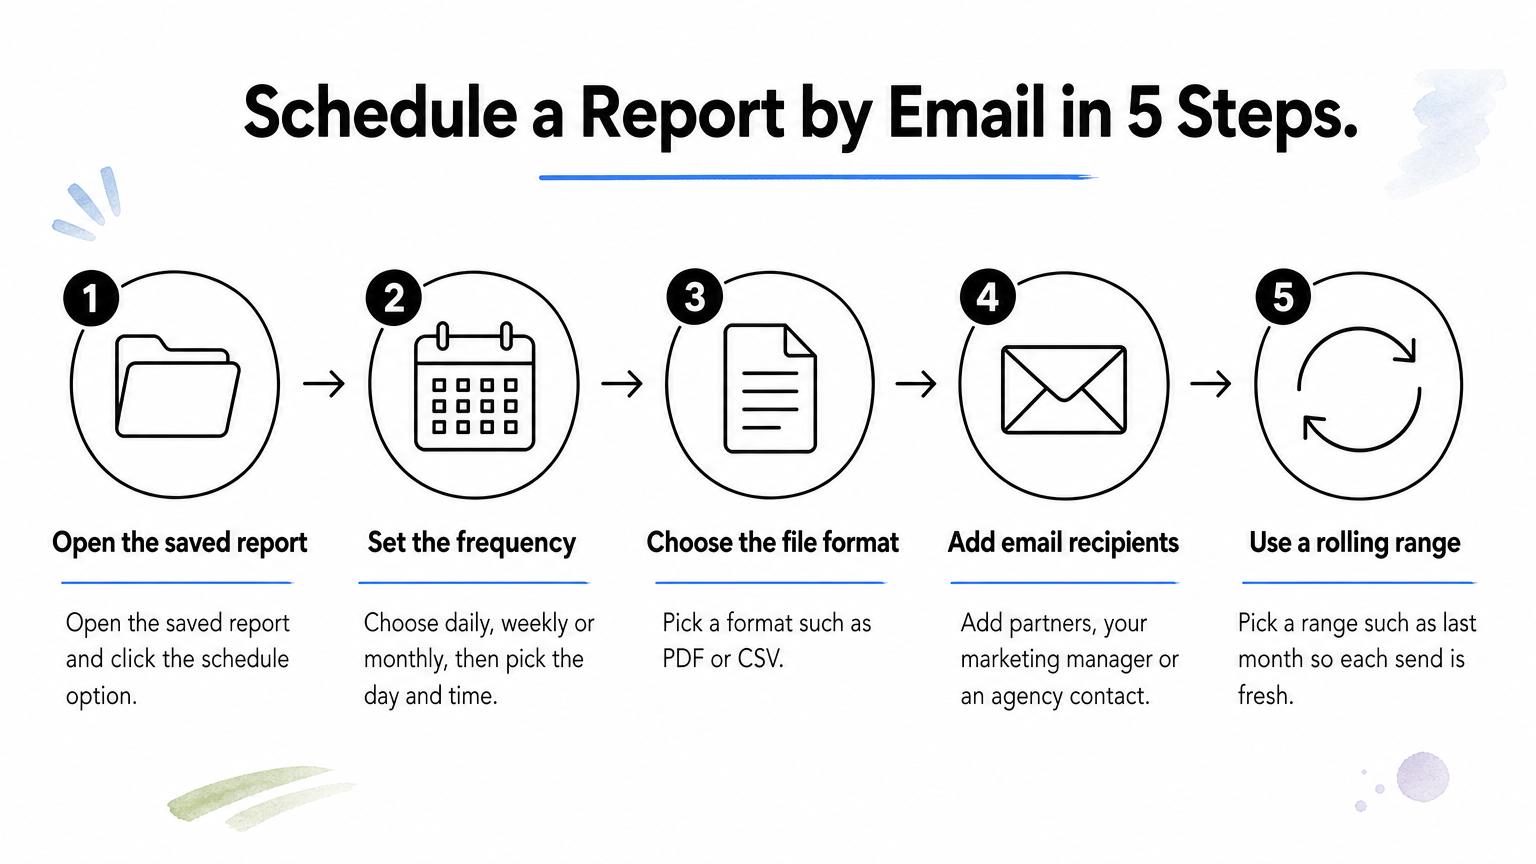
- Open the saved report and click the schedule option.
- Set the frequency to daily, weekly or monthly, and pick the day and time.
- Choose the file format, such as PDF or CSV.
- Add the email addresses of your partners, marketing manager or agency contact.
- Use a rolling date range, such as last month, so each send covers fresh data.
Match the schedule to how fast the decision moves. A weekly report suits a firm adjusting bids. A monthly report suits partners who only want the trend.
Three reports worth saving first
These three setups cover most of what a firm needs.
- Campaign scorecard: rows are campaigns, with Cost, Conversions, Cost / conv. and Search lost IS (budget). It shows where to move budget.
- Search term review: rows are search terms, with Clicks, Cost and Conversions. It shows which queries to add as negative keywords.
- Day and hour: rows are day of week and hour, with Conversions and Cost / conv. It shows when to adjust bids or the ad schedule.
The search term review is where wasted spend hides. A query like "dui penalties by state" costs the same per click as "dui lawyer near me" but rarely becomes a client. Run this report every two weeks and add the junk queries as negatives. If you would rather hand that work off, managed Google Ads for law firms is what GavelGrow's team does.
Save the campaign scorecard, search term review and day-and-hour report first, and schedule all three.
Step 4. Connect the report to signed cases
Google Ads reports stop at conversions, so to see what a campaign really costs you have to bring signed cases into the same report. Cost per conversion measures leads, not clients.
Why cost per conversion misleads
Take two campaigns, each with $6,000 in monthly spend. These numbers are illustrative.
- Campaign A: $6,000 spend, 50 conversions at $120 each, and 3 signed cases. Cost per signed case is $2,000.
- Campaign B: $6,000 spend, 30 conversions at $200 each, and 7 signed cases. Cost per signed case is $857.
- Total: $12,000 spend, 80 conversions at $150 each, and 10 signed cases. Cost per signed case is $1,200.
Campaign A looks better in the Report Editor, with the lower cost per conversion. Campaign B signs more than twice as many cases for less than half the cost per client. A firm that cuts B to save money cuts its best campaign. To run this math on your own numbers, use the cost-per-acquisition calculator.
Bring signed cases back into Google Ads
Google Ads accepts offline conversions, which means you tell it when a lead became a signed retainer. Once that data is imported, signed cases appear as a conversion column, and every report you built in Step 2 can show cost per signed case. You can import the data by hand in a file, or send it automatically. GavelGrow's Smart Conversions does the automatic version, sending signed cases back to Google Ads when the case is marked signed. It sends on the Optimize plan and previews on Track. It does not change Local Services Ads bidding, because those ads cannot accept the signal.
Two cautions apply. Offline imports take time to show up, so judge a campaign on a window long enough for matters to close. And calls that never became form fills only count if they are tracked by campaign, so make sure call tracking is in place before trusting the numbers.
Report on cost per signed case, not cost per conversion, or you will fund the wrong campaigns.
Frequently asked questions
Where is the Report Editor in Google Ads?
Click Reports in the left-hand menu of your account, then open the Report editor. Google moves menu items now and then, so if the label has shifted, search the account for "report editor". It runs in your browser, so there is nothing to install.
Is the Report Editor the same as Google Ads Editor?
No. The Report Editor is the browser tool for building tables and charts. Google Ads Editor is a separate desktop app for offline bulk edits to campaigns, such as rewriting many headlines. Use the Report Editor to answer performance questions and Google Ads Editor to change campaigns in bulk.
Can you schedule Google Ads reports by email?
Yes. Open the saved report, click the schedule option, set the frequency, pick the file format such as PDF or CSV, add the recipients, and use a rolling date range such as last month so each send covers fresh data. A weekly report suits a firm adjusting bids, and a monthly report suits partners who want the trend.
Which columns should a law firm add to a Google Ads report?
Keep it to eight or ten: Cost, Clicks and Impr., CTR, Avg. CPC, Conversions, Cost / conv., Conv. rate, Search impr. share and Search lost IS (budget). The last one shows whether your budget is capping a strong campaign, which is often a smarter place to add spend than a new campaign.
Can the Report Editor show cost per signed case?
Only if signed cases are imported into Google Ads as offline conversions. Without that, Google Ads reports stop at conversions, which count leads rather than clients. Once signed cases are imported, they appear as a conversion column and your saved reports can show cost per signed case. Offline imports take time, so judge a campaign over a window long enough for matters to close.
Build the report once, then let it run
The Google Ads Report Editor takes you from a vague question to a saved, scheduled report in four moves: open it and pick a format, add columns and filters, save and schedule, and finally connect the numbers to signed cases. The first three keep your reporting off your calendar. The fourth keeps you from cutting the campaign that actually fills your pipeline.
Start with the campaign scorecard this week, schedule it monthly, and add the search term review next. Then work on getting signed cases back into Google Ads. If you want that attribution without stitching tools together, try the GavelGrow platform free for 7 days, with no credit card required.
Frequently Asked Questions
Where is the Report Editor in Google Ads?
Click Reports in the left-hand menu of your account, then open the Report editor. Google moves menu items now and then, so if the label has shifted, search the account for "report editor". It runs in your browser, so there is nothing to install.
Is the Report Editor the same as Google Ads Editor?
No. The Report Editor is the browser tool for building tables and charts. Google Ads Editor is a separate desktop app for offline bulk edits to campaigns, such as rewriting many headlines. Use the Report Editor to answer performance questions and Google Ads Editor to change campaigns in bulk.
Can you schedule Google Ads reports by email?
Yes. Open the saved report, click the schedule option, set the frequency, pick the file format such as PDF or CSV, add the recipients, and use a rolling date range such as last month so each send covers fresh data. A weekly report suits a firm adjusting bids, and a monthly report suits partners who want the trend.
Which columns should a law firm add to a Google Ads report?
Keep it to eight or ten: Cost, Clicks and Impr., CTR, Avg. CPC, Conversions, Cost / conv., Conv. rate, Search impr. share and Search lost IS (budget). The last one shows whether your budget is capping a strong campaign, which is often a smarter place to add spend than a new campaign.
Can the Report Editor show cost per signed case?
Only if signed cases are imported into Google Ads as offline conversions. Without that, Google Ads reports stop at conversions, which count leads rather than clients. Once signed cases are imported, they appear as a conversion column and your saved reports can show cost per signed case. Offline imports take time, so judge a campaign over a window long enough for matters to close.